
Image Details
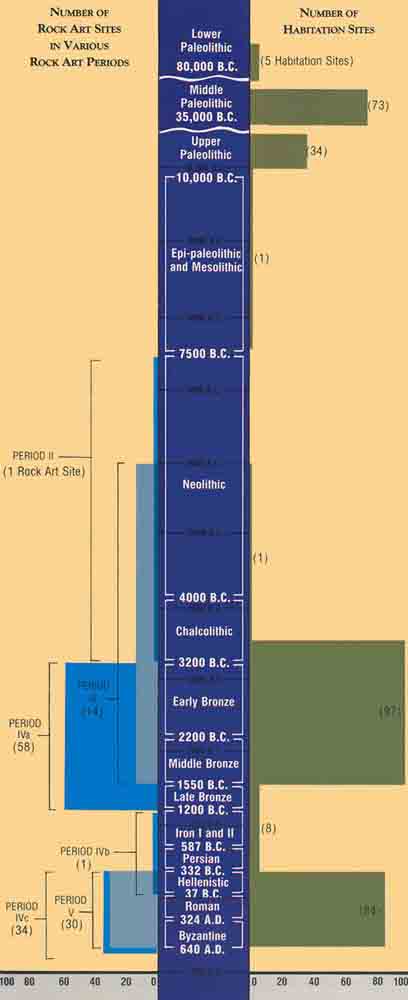
Attached to the time line on the left are boxes identifed by rock art style periods. Note that the periods of rock art styles overlap. The numbers in parentheses indicate the number of sites at Har Karkom from each period. This number can also be read from the left-hand horizontal axis on the bottom.
Attached to the time line on the right are boxes showing the distribution of archaeological habitation sites at Har Karkom. The number of sites for each period is written within or next to its box, or it may be read from the right-hand horizontal axis at the bottom of the chart.
Several important facts emerge from this chart. During the Paleolithic period, before 10,000 B.C., Har Karkom was occupied, but the settlers did not leave rock art remains. For the next 7,000 years almost no one lived at Har Karkom, and the rock art remains were meager. Then in about 3500 B.C. settlers again moved into the Har Karkom area in large numbers, remaining there for about 2000 years. During most of this period of intense occupation, the settlers also produced an abundance of rock art in style IVa at nearby cultic sites. After 1550 B.C.—for more than 1000 years—settlement dwindled and the production of rock art almost ceased. Another burst of settlement and art occurred in the fourth century B.C. and continued through the Byzantine period.